

Rapid LVV Titer Determination with the Virus Counter Plus Platform
In Part One of this blog series, we introduced the challenges of LVV purification and quantitation. In Part Two, we described the Virus Counter Plus platform (Sartorius) for rapid determination of LVV titer.
Here in Part Three we focus on the results of a study comparing the data obtained using the Virus Counter Plus system to those generated using standard quantitative polymerase chain reaction (qPCR) and p24 enzyme-linked immunosorbent assay (ELISA) techniques for physical titer and a transduction unit (TU) assay for functional titer.
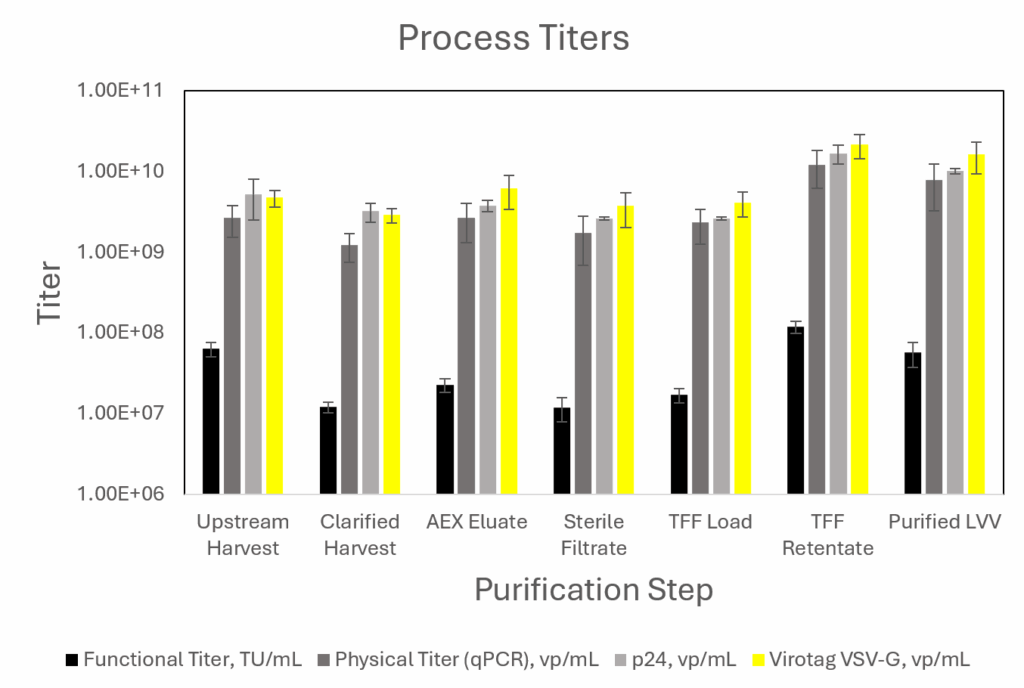
For each individual unit operation, a good correlation was observed between the Virus Counter Plus data and the results obtained using the qPCR and p24 ELISA physical titer methods (Figure 1). The VSVG-derived particle count to TU/mL ratio calculated based on the Virotag® data was ~215 and close to the ABL, Inc.’s qPCR to TU/mL ratio of ~190 (1 ng/mL of p24 ≈10⁴ − 10⁵ TU/mL) results. Both fall well within the industry-accepted range of 100 – 1,000. Good correlation between the Virus Counter Plus data and results for the traditional physical titer methods was also observed for the entire process, the upstream harvest, and the set of downstream processing data.
Figure 1: Physical Titer (qPCR and p24 [vp/mL]) and Activity (Functional Titer [TU/mL]) Data for Each Process Step Compared to Virus Counter® Plus (Virotag® VSVG [vp/mL]) Measurements
Comparing VCP with established methods for physical titer
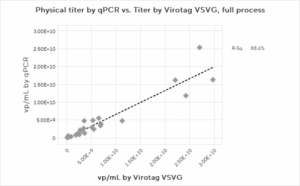
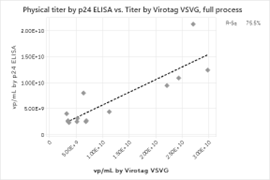
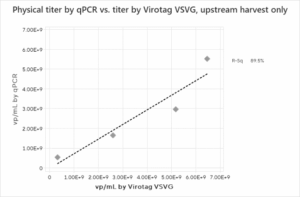
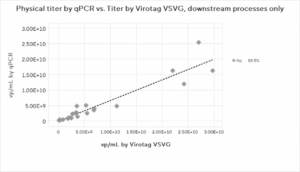
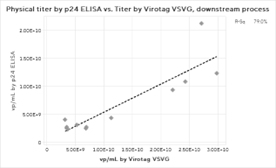
We first assessed the correlation between the physical titer assays. Figure 2 shows the physical titer correlations for the full process, Upstream process and the Downstream process steps alone. A strong correlation between physical titer (from genome copies and p24 ELISA) and Virus Counter Plus data for the overall process is observed. The correlation maintains strength when the upstream harvest data is separated from the downstream steps. The correlation data for the physical titer methods indicate that the Virus Counter Plus assay targeting the VSVG pseudotype quantifies the same particles as the established methods evaluated in the study.
Figure 2: Physical Titer by PCR and p24 ELISA and Virus Counter VSVG result correlations for (a) full process, (b) upstream harvests only, and (c) downstream processes only. Due to insufficient data, no p24 ELISA correlation could be found for the upstream harvest.
a)
b)
c)
The results clearly showed that the Virus Counter Plus data aligns closely with the qPCR and p24 ELISA physical titer methods for each individual unit operation and for the entire process, the upstream harvest alone, and the overall downstream processing data.
Evaluating how Virotag VSVG correlates with functional titers
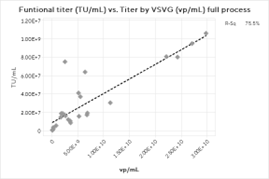
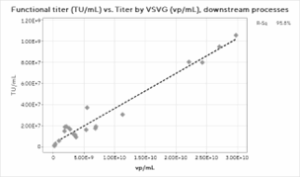
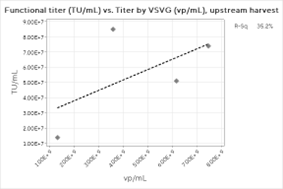
The overall correlation between the Virotag VSVG and the transduction assay results is weaker than the correlations with the physical titers (Figure 3). It is important to note that TU/mL results are inherently more prone to statistical noise than any physical titering method, and more data points would likely improve the results. The mean ratio across the process for the Virotag VSVG results in vp/mL to the functional titer in TU/mL was 214.7 with a standard deviation of 111, which is an expected result for lentivirus preparations. Interestingly, the correlation strengthened significantly when only the downstream process data were plotted, likely due to a single high outlier for the upstream harvest material.
Figure 3: Functional Titer Correlations for A) Full Process, B) Downstream Process, and C) Upstream Harvest
a)
b)
c)
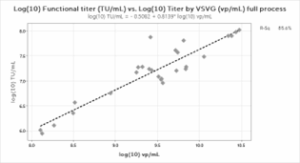
Even though the functional titer correlation for the full process was weak, we found that it was possible to develop a predictive model for estimating the functional titer of LVV processes using the Virus Counter Plus system. Using the data generated in the study for the overall LVV production process (Figure 4), several different fitting techniques were evaluated to identify an optimal model. It was determined that a log₁₀ transformation of both the TU/mL and VSVG-derived vp/mL data yielded the most promising results.
Figure 4: Modeling of the Transducing Unit and Virotag® VSVG Titer. A) Correlation of the log-transformed data used to generate the model; B) Correlation between the measured TU/mL and the predicted TU/mL.
a)
b)
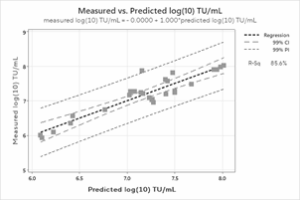
Equally promising are the results obtained with the optimal predictive model developed using the data generated in the study. A correlation between the predicted and the actual log10-transformed TU/mL of 86% was achieved along with a perfect slope and y-intercept of 0, indicating that the model reliably reproduces the measured results. Of course, additional data will enable refining and further improvement of the reliability of the model. Even with the limited data used, however, it is clear the Virus Counter Plus VSVG titer data can be employed to predict functional titer values, reducing the time to result by a factor of 14 or more (two weeks to one day).
This user-friendly system not only provides quick (near-real-time) and precise determination of total particle counts during development of LVV production and purification processes, but the results also correlate well with those obtained using qPCR and p24 ELISA methods, and the data can be used to accurately estimate functional titer measurements once a predictive model has been established. In addition, the system requires minimal sample preparation and provides results within 24 hours or less, making it a more efficient choice for high-throughput screening and real-time monitoring of viral titers. As a result, it is possible to eliminate the need for lengthy and variable analytical techniques and achieve quicker, more robust titer data acquisition with less hands-on time, both of which support accelerated development of robust LVV manufacturing processes.
Conclusion
Data from the Virus Counter Plus (using the Virotag VSVG assay) correlated well with data obtained using other reliable physical titer methods and a transducing unit assay across all steps of the Ascend-ABL LVV production process. We also showed that it is possible to build a reliable predictive model for estimating functional titers based on the direct titer measurements afforded by the Virus Counter Plus system.
Compared to traditional qPCR and ELISA methods for physical titer measurement, the Virus Counter Plus platform provides direct quantification of LVV particles without the need for extensive sample preparation or manipulation, simplifying and accelerating the analysis. Similarly, the ability to generate predictive models has the potential to dramatically reduce timelines and enable fast and confident process optimization by lowering the demand for time-consuming functional assays.
Authors: Poorni Adikaram, PhD, Tyler Frazier and Timothy Fouts, PhD, CSO at ABL Inc. and Rebecca Montange, PhD and Brandon Harrell at Sartorius
To learn about current LVV titer determination challenges, view Part One. And read a discussion on how the Virus Counter Plus Platform works in Part Two.
Would you like to discuss how Ascend ABL can support your LVV production? Contact us using the form below
