

The ABL p24 ELISA kit, originally developed for HIV titer determination, has evolved into a critical tool for the quantification of lentiviral vector (LVV) titers in cell and gene therapy applications. This study highlights its performance in detecting LVV titers across in-process samples during industrial-scale lentiviral production and purification. Comparative analysis with four other commercial kits demonstrates the superior accuracy, consistency, and reliability of the ABL kit, particularly in early-stage and low-titer samples.
The ABL kit features a cost-effective and convenient protocol with high sensitivity (3–100 pg/mL), requiring minimal sample volume and providing results in under three hours. Unlike recombinant methods, its natural component design ensures high specificity and low variability in crude or low-titer samples. Key findings include strong correlation coefficients (R²), favorable viral particle (VP) ratios (i.e. VP -p24/VP-GC) and low coefficients of variation (CV%), underscoring the kit’s robustness across all process stages.
The study validates the ABL kit as a precise, reliable, and versatile solution for LVV titer determination. These attributes make it an ideal choice for process development, quality assurance, and GMP-compliant applications in the production and purification of lentiviral vectors for cell and gene therapies.
Introduction
The gag p24 viral protein is a reliable marker for HIV, and p24 ELISA kits are commonly used to determine HIV titers. The ABL p24 ELISA Kit was one of the first commercially available kits in the market and has undergone more than 20 years of optimization to ensure stable and consistent performance with HIV titer determination.
Here we demonstrate how the same consistency of performance is observed when quantifying lentivirus, which is part of the same retrovirus family as HIV and shares structural and biological similarities.
Components in the ABL kit (Catalog #5421 & #5447) are derived as follows (Figure 1).
- ABL p24 standard: purified from a cell line constitutively producing HIV-1. By contrast to recombinant p24, purification in this manner offers a more biologically relevant control.
- Capture antibodies: two carefully selected monoclonal antibodies derived from mouse immunized with purified viral p24 protein.
- Detection antibody: polyclonal antibody purified from HIV-positive human plasma.
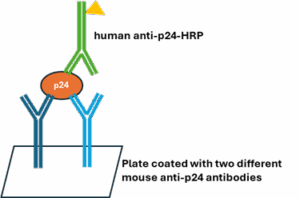
Figure 1. Schematic showing p24 determination using ABL p24 ELISA kit.
LVV Purification
Challenges in quantifying samples for LVV industrial production (Figure 2) include a poor correlation between genomic titer and p24 results when evaluating in-process LVV samples , most notably in early-stage and low-concentration samples. However, this issue has not been observed by scientists at ABL using the ABL p24 ELISA kit. Consequently, a comparison study was performed to study the ABL kit against those offered by other vendors.
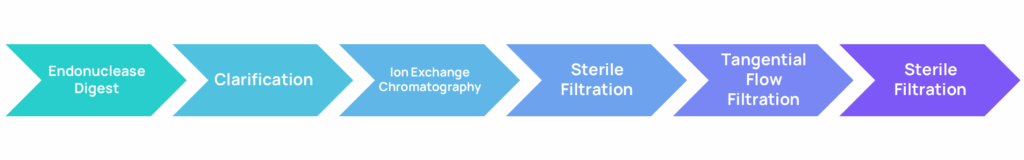
Figure 2: ABL’s GMP-compatible lentivirus purification platform. 20 L of 293 cells in bioreactor are harvested 48 hours post transfection. Then the cell suspension is treated with DNA endonuclease, clarified through depth filters, and purified via anion exchange chromatography. The sterile-filtered product is stored at 4°C overnight, concentrated, and diafiltrated using Tangential Flow Filtration. Finally, the virus is sterile-filtered again and stored at -80°C.
Methods
ELISA protocol briefly is as follows:
- Wash 96-well plate (coated with two mouse α-p24 antibodies, recognizing distinct epitopes of the p24 protein).
- Add 25 µL disruption buffer and 100 µL of the p24 standard or samples, incubate 37°C x 1 hr.
- Wash the plate, add 100 µL of the conjugate solution (HRP-conjugated human α-p24 polyclonal antibody). Incubate 37°C x 1 hr.
- Wash the plate again, add 100 µL peroxidase substrate, and incubate RT x 30 min.
- Add 100 µL of stop solution and read the absorbance at 450 nm.
For complete protocol please visit our website.
LVV in process samples were collected from three independent 20 L purification runs. Each LVV in-process sample was divided into multiple smaller aliquots and tested at two dilutions with each in duplicate using the ABL kit and ELISA kits from four other vendors (B, C, D & E). Genomic titers were measured via RNA extraction followed by qRT-PCR. Two of the kits were selected for re-testing of all samples using different dilutions, ensuring consistent & reproducible results, characterized by coefficient of variance (CV) % < 20%.
Virus particle concentration (VP/mL) were calculated as follows:
- VP-p24 (VP/mL (from p24)) = p24 conc. (ng/mL) x 1.0E+07.
- VP-GC (VP/mL (from Genomic titer)) = virus genomic copy conc. (vg/mL) ÷ 2.
Samples were categorized into the following subgroups for analysis:
- Total Samples
- Lower Titer: GC Titer < 4.0E+09 vg/mL
- Higher Titer: GC Titer ≥ 4.0E+09 vg/mL
- Early Steps: Harvest, Anion Exchange (AEX) load
- Later Steps: AEX eluate, TFF retentate & final filtered product
Correlation between virus particle concentration derived from genomic titer and VP concentration derived from p24 in every subgroup was evaluated across all subgroups using two methods:
- R2 (Coefficient of determination): a bigger R2 indicates stronger correlation, reflects higher reliability
- VP-p24/VP-GC Ratio and CV%:
– An average ratio ≈ 1.0 indicates that the p24 concentration aligns with the reported standard (1 ng p24 = 1.0E+07 VP).
– To address the bias of R² being influenced more heavily by high-titer samples, the CV% of individual sample ratios was used to assess correlation strength within subgroups. A smaller CV% indicates a stronger correlation and, therefore, a more accurate result.
Results
Correlation between p24 ELISA kits and genomic titer.
Testing lentiviral vector in-process samples using the ABL p24 ELISA kit demonstrates a strong correlation with genomic titer, as compared to Kits B, C, D and E, particularly for low titers and early step samples (Figure 3).
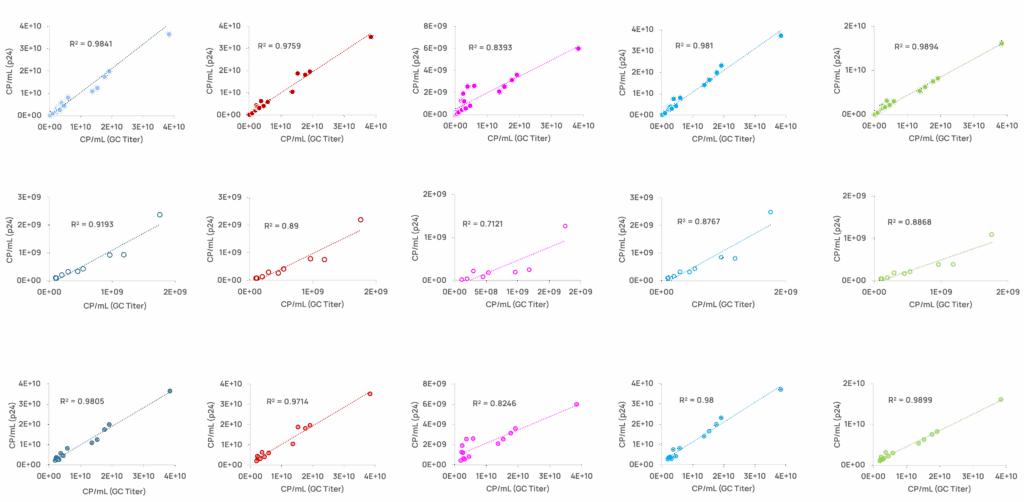
Figure 3. Graphs show VP-p24 concentration plotted against VP-GC concentrations using linear regression. X-axis is VP concentration calculated from genomic copies; Y axis is the VP concentration from p24. Each colored dot represents an individual sample, while the colored line is the trend line indicating calculated correlation from the samples within the sub-category. Coefficient of determination (R2) is showed on each graph
Kit-B performs poorly overall, except for high-titer samples. Kits C, D, and E demonstrate good correlations in high-titer and later-step samples but poor correlations (R2 < 0.9) in low-titer and early-step categories. The ABL kit surpasses all others in these two subcategories, especially in early-step samples, achieving a significantly higher R2 (0.961 vs. ≤0.852 for others) (Table 1).
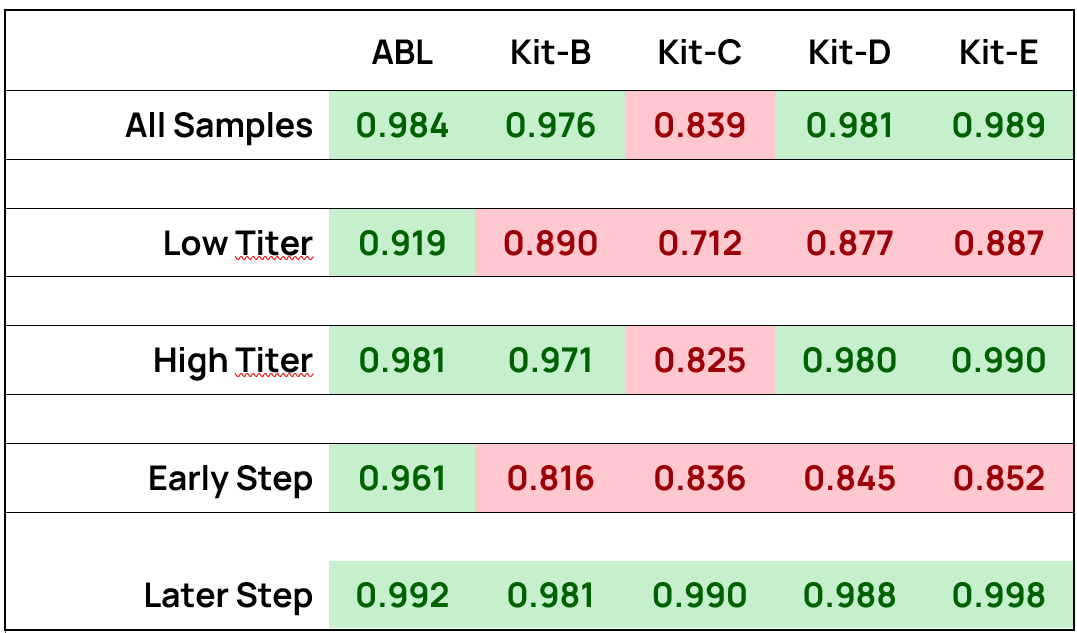
Table 1. R² values for p24 ELISA Kits across sub-categories, reflects the correlation between VP-p24 and VP-GC concentration.
Within each subcategory, darker green shading represents higher R² value, indicating stronger correlation between the two measurements, while darker red indicates smaller R² and value weaker correlation.
Analysis of p24/GC ratio & CV% to assess correlation strength
Higher titer samples have a greater impact on R² than lower titer samples. To address this, we employed an alternative approach, calculating the average VP-p24/VP-GC ratio and using the coefficient of variation (CV%) to assess correlation strength within subgroups.
The ABL kit achieves an average ratio of 1.03, consistent with the reported equivalence of 1 ng p24 = 1.0E+07 VP. In contrast, Kit-C and Kit-E show significantly lower ratios (0.33 and 0.49, respectively) (Figure 4). Although Kit-B and Kit-D have average ratios closer to 1.0 (1.28 and 1.12, respectively), their broader distributions (Kit-B: 0.72–2.44; Kit-D: 0.68–2.01) result in much higher CV%. Both the ABL Kit and Kit E demonstrate low CV% (as compared to Kit-B, C and D), highlighting higher reproducibility of the ratio (Table 2).
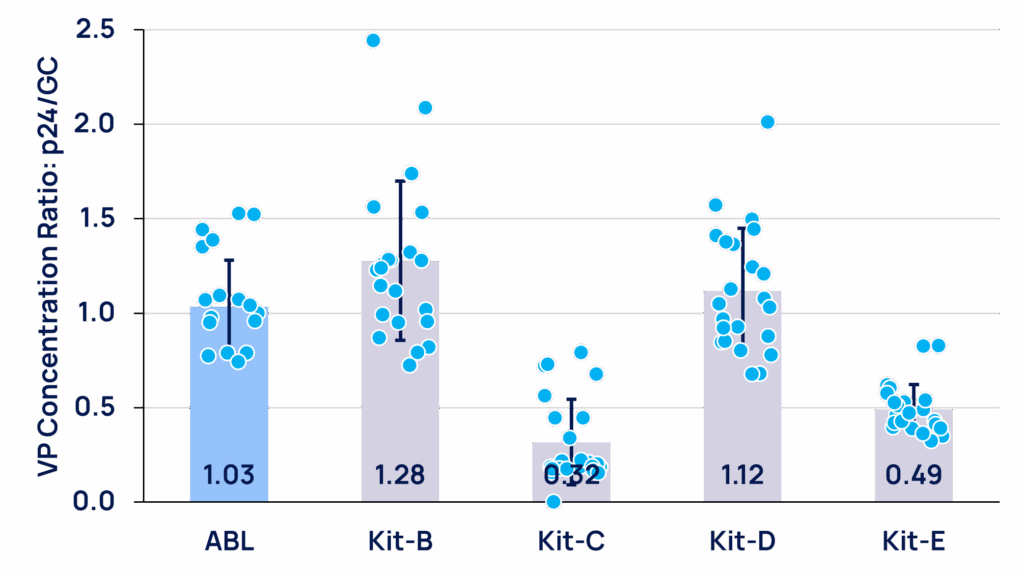
Figure 4. Average ratios of VP-p24 / VP-GC and sample distributions of each kit in “All sample” subcategory.
• The average ratio of each kit is indicated at the bottom of each bar.
• Each blue dot represents a ratio of an individual sample.
Notably, the ratio of VP-p24 to VP-GC in early-step samples is generally greater than 1.0, likely reflecting the presence of free-floating p24 in lentiviral production harvests. During purification, this ratio decreases to ~1.0 or slightly below, indicating the removal of free-floating p24. Exceptionally high ratios (>10) were observed only in ion exchange flow-through samples, where large amount of free-floating p24 is separated from LVV virion and passed into the flow-through during ion exchange chromatography. Therefore, flow-through was the only sample that was excluded from our statistical analyses.
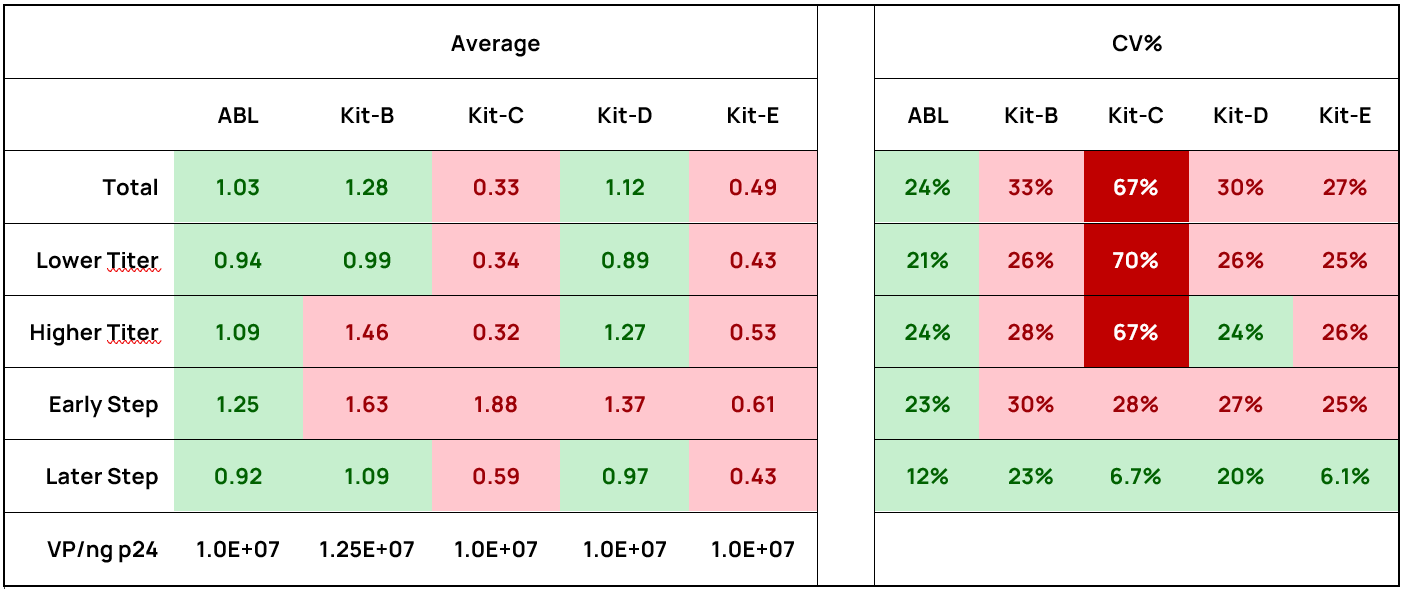
Table 2. The average VP-p24 / VP-GC ratios and the CV% of these ratios for each kit across all subgroups.
In each subgroup, smaller CV% values are shaded in darker green, indicating a stronger correlation, while larger CV% values are shaded in darker red, reflecting a weaker correlation.
Comparison of kit and operational costs.
We compared the ABL p24 ELISA kit with competitor kit prices, operation time, and process. The kit compares favorably in price. Its operation process, which requires 2 to 3.5 hours and involves three major steps, falls into the medium category in terms of complexity, offering a good balance of cost and convenience.
| ABL | Kit-B | Kit-C | Kit-D | Kit-E | |
|---|---|---|---|---|---|
| Price | $ | $ | $$$ | $$$ | $$ |
| Operation Time (h) | 2-3.5 | 2-3.5 | <2 | >3.5 | >3.5 |
| # Steps | 3 | 4 | 2 | 4 | 3 |
Conclusions
This study highlights the ABL p24 ELISA kit as an accurate, reliable and superior tool for LVV titer determination in cell & gene therapy applications.
- Satisfactory R2 values of p24 with GC in all LVV in-process samples, especially in low-titer & early-step samples.
- Favorable p24/GC ratios with less variation (CV%) among LVV in-process samples as compared to competitor kits.
- Cost-effective, moderate incubation time & reasonable number of operation steps.
Features and benefits of the ABL p24 ELISA kit.
Sensitive: Quantitation down to picogram level: 3 to 100 pg/mL. This assay can accurately detect virus concentrations as low as 1.0 × 10⁵ VP/mL. In contrast, the genomic titer kit used in this study has a. detection limit of 1.0 × 10⁷ VP/mL.
Convenient:
- Single plate and bulk formats
- Pre-formulated reagents
- Just 3 incubation steps
- Removable 8-well strips
Efficient:
- Low sample volume: typically less than 10 µL
- Results in < 3 hours
Robust:
- Strong correlation with genomic titer measurement
- Results are stable over time compared to genomic titer analysis of stored RNA
To order the ABL p24 ELISA Kit visit our product page
Authors
Shanshan Zhu, Wei Zou, Poorni Adikaram, Jian Wang, Madeline Kalisz, Vivek Shukla, Shayesteh Fathieh, Krishna Chauhan, Isabelle Pelletier, Tyler Frazier, Ran-Der Hwang, Leon Toussaint, Elena Gustchina, Peter Silvera, Brian Taylor and Timothy Fouts
